

-

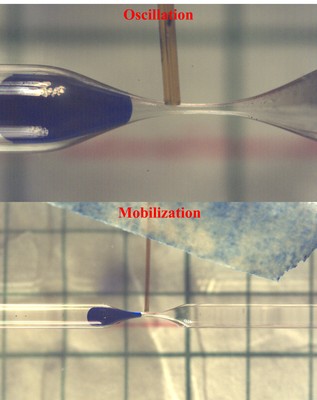
Initial Position Hexane-Ratio 4.5
Yandong Zhang, Chao Zeng, Baojun Bai, and Wen Deng
The initial position of the non-wetting droplets photo (.bmp) files can be open in simple viewer or ImageJ for further analysis.
-

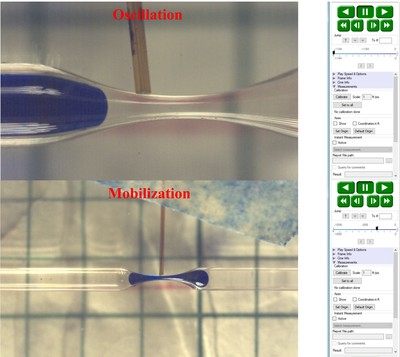
Original recorded video file of the hexane droplet subjected to 10 to 50 Hz seismic stimulation
Yandong Zhang, Chao Zeng, Baojun Bai, and Wen Deng
Further interesting work are encouraged and can be done freely based on the original raw files.
-

Manual-Tracked Datapoint
Yandong Zhang, Chao Zeng, Baojun Bai, and Wen Deng
The manual-tracked data point (.pps format) files can be open in Microsoft Excel software. One can find seven column of data points in each file. ‘ImageNr.’ indicates the frame number for each video. ‘TimeFromTrig.’ is the time interval reference from the beginning of each recording process and the unit is second (s). ‘Absolute Time’ is the accurate 24-hour clock time (CST) and MM/DD/YY log when each frame is taken of each video. ‘X0’ and ‘X1’ are the horizontal motion displacements of upstream front meniscus and the marker in feet (ft), respectively. ‘Y0’ and ‘Y1’ are the vertical motion displacements of upstream front meniscus and the marker in feet (ft), respectively. During our data analysis, we only considered the horizontal displacements ‘X0’ and ‘X1’ while the point we chose can move vertically only in a small degree because the error raised by manual tracking. All data points were partially collected since we only needed several periods of vibration to compare with the theoretical results. More points from any interesting places in the video can be further manual or auto-tracked in the software. The number of data point in each file varies for different frequencies and acceleration amplitudes. Data points of at least three periods of vibration were collected to ensure a good comparison with theoretical results. We also upload two demo videos for the oscillation and mobilization processes to give a general concept of the vibration process in a constricted tube.
Printing is not supported at the primary Gallery Thumbnail page. Please first navigate to a specific Image before printing.
